An excess of calcium in swine diets may increase excretion of phosphorus due to formation of Ca-P complexes. Therefore, when formulating diets for pigs, it is important to consider the ratio of calcium to phosphorus. The proper ratio should ensure that both minerals are maximally utilized in the bodies of the pigs.
A previous study conducted in the Stein Monogastric Nutrition Lab set out to determine the requirement for standardized total tract digestible (STTD) calcium in 11 to 25 kg pigs. More research is needed on STTD calcium requirements because until recently, digestibility data for calcium in feed ingredients were not available. Therefore, an experiment was conducted to determine the requirement for STTD calcium by 25 to 50 kg pigs needed to maximize average daily gain, gain:feed ratio, and bone ash at different concentrations of STTD phosphorus.
Materials and methods
A total of two hundred and forty pigs with an average initial body weight of 24.70 kg were randomly allotted to 20 corn-soybean meal diets. The requirements for STTD phosphorus and total calcium in the 2012 NRC are 0.31 and 0.66%, respectively. To test responses to phosphorus and calcium inclusion below, at, or above requirements, the experimental diets were formulated to contain 0.15, 0.31, 0.39, or 0.47% STTD phosphorus and 0.18, 0.42, 0.66, 0.90, or 1.14% total Ca (0.13, 0.27, 0.42, 0.57, or 0.72% STTD calcium).
Pigs were weighed on days 1 and 28. The total amount of feed offered and the amount of feed left in the feeders on the last day of the experiment were recorded to determine feed intake. Average daily gain and gain:feed ratio were calculated over the 28-day period. On day 28, pigs were euthanized, and their right femurs were removed and analyzed for bone ash.
Results
Table 1 shows the average daily gain, gain:feed ratio, and bone ash at the 20 different combinations of calcium and phosphorus levels. The results are also shown in graphical form in Figures 1, 2, and 3 below. When the amount of phosphorus in the diets was below the requirement, increasing levels of calcium in the diet led to decreased growth performance. However, when phosphorus was included at or above the required level of 0.31%, increasing the concentration of STTD calcium increased average daily gain, gain:feed, and bone ash up to a point, and excess calcium affected performance less than in phosphorus-deficient diets.
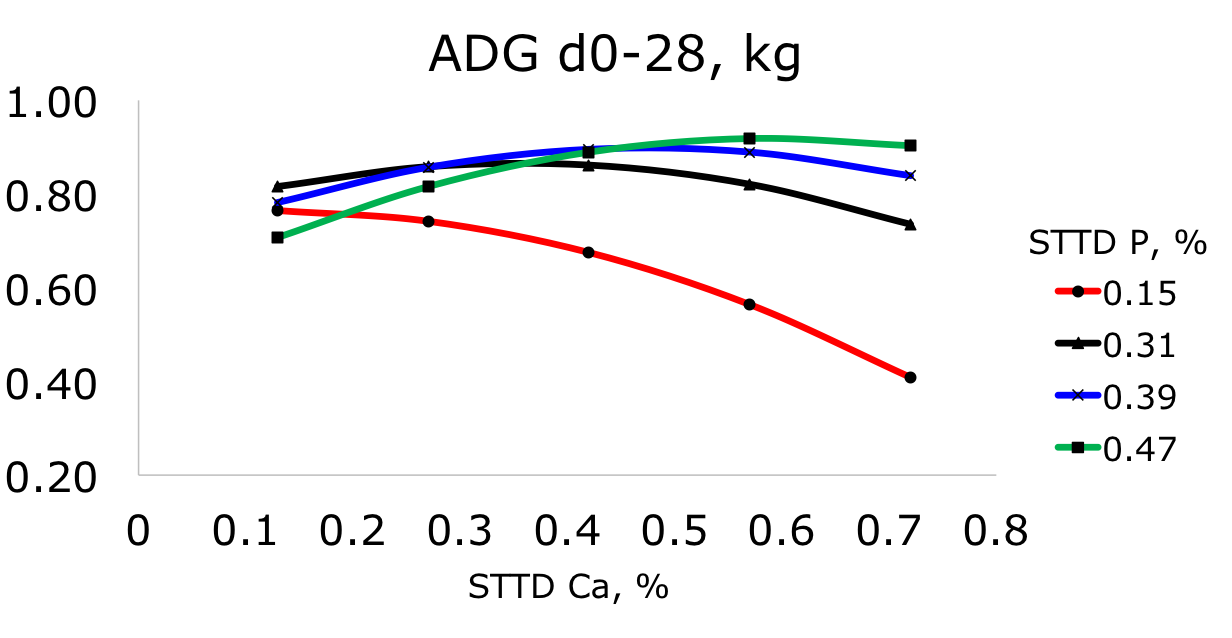
Figure 1. Average daily gain (ADG) from d 1 to 28 in pigs fed diets containing from 0.13 to 0.72% standardized total tract digestible (STTD) Ca and from 0.15 to 0.47% STTD P.
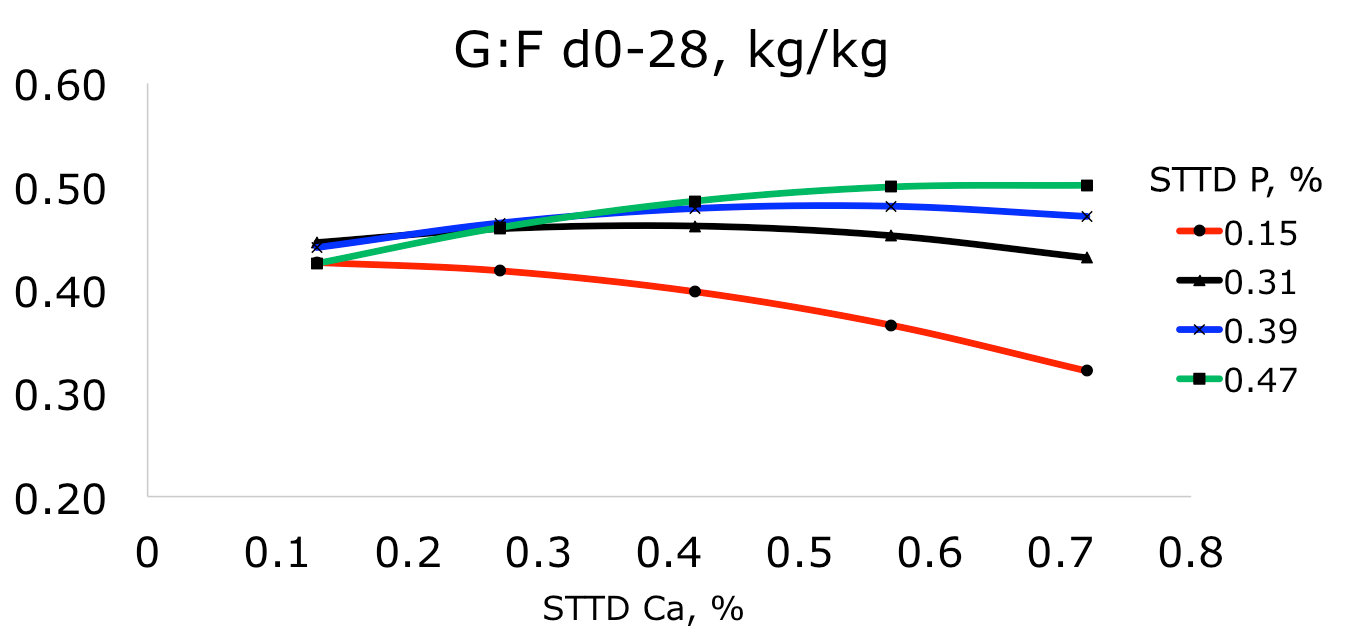
Figure 2. Gain to feed ratio (G:F) from d 1 to 28 in pigs fed diets containing from 0.13 to 0.72% standardized total tract digestible (STTD) Ca and from 0.15 to 0.47% STTD P.

Figure 3. Bone ash (g) in pigs fed diets containing from 0.13 to 0.72% standardized total tract digestible (STTD) Ca and from 0.15 to 0.47% STTD P.
Maximizing average daily gain, gain:feed, and bone ash
A regression analysis was performed on the results to predict maximum performance at each level of phosphorus, as well as how much calcium would be required to attain that maximum performance. The results of this analysis are summarized in Table 2.
If diets met or exceeded the phosphorus requirement, the STTD Ca values to maximize average daily gain and gain:feed ranged from 0.36 to 0.67%, which corresponded to a STTD Ca:STTD P ratio between 1.16:1 and 1.43:1. The STTD calcium values to maximize bone ash ranged from 0.56 to 0.69%, which corresponded to a STTD Ca:STTD P ratio between 1.47:1 and 1.81:1. However, growth performance was decreased at those ratios.
Key points
- If diets meet or exceed the requirement for STTD phosphorus, the STTD Ca:STTD P ratio needed to maximize average daily gain and gain:feed is between 1.16:1 and 1.43:1, and the ratio needed to maximize bone ash is between 1.47:1 and 1.81:1.
- Diets for growing-finishing pigs should be formulated using a ratio of STTD Ca:STTD P between 1.16:1 and 1.43:1.
Table 1. Least squares means for ADG and G:F from d 1 to 28 and bone ash at d 28 in pigs fed diets containing from 0.13 to 0.72% standardized total tract digestible (STTD) Ca and from 0.15 to 0.47% STTD P
|
|
STTD Ca, % |
||||
|
Item |
0.13 |
0.27 |
0.42 |
0.57 |
0.72 |
|
ADG, kg |
|||||
|
0.15% STTD P |
0.80 |
0.72 |
0.64 |
0.58 |
0.41 |
|
0.31% STTD P |
0.80 |
0.86 |
0.90 |
0.88 |
0.71 |
|
0.39% STTD P |
0.78 |
0.85 |
0.85 |
0.86 |
0.86 |
|
0.47% STTD P |
0.69 |
0.89 |
0.86 |
0.93 |
0.89 |
|
G:F, kg:kg |
|||||
|
0.15% STTD P |
0.44 |
0.41 |
0.39 |
0.38 |
0.30 |
|
0.31% STTD P |
0.44 |
0.46 |
0.46 |
0.46 |
0.44 |
|
0.39% STTD P |
0.43 |
0.45 |
0.47 |
0.48 |
0.49 |
|
0.47% STTD P |
0.43 |
0.48 |
0.48 |
0.50 |
0.48 |
|
Bone ash, g |
|||||
|
0.15% STTD P |
12.49 |
13.48 |
12.95 |
13.11 |
11.63 |
|
0.31% STTD P |
13.59 |
17.44 |
21.76 |
21.71 |
19.49 |
|
0.39% STTD P |
12.98 |
15.71 |
21.14 |
23.86 |
22.02 |
|
0.47% STTD P |
12.44 |
18.56 |
20.29 |
23.67 |
24.37 |
Table 2. Predicted maximum values for ADG and G:F from d 1 to 28, and bone ash at d 28 in pigs fed diets containing 0.15 to 0.47% STTD P.
|
|
STTD P, % |
|||
|
Item |
0.15 |
0.31 |
0.39 |
0.47 |
|
ADG, kg |
0.76 |
0.87 |
0.90 |
0.92 |
|
STTD Ca1 |
0.12 |
0.36 |
0.47 |
0.59 |
|
STTD Ca:STTD P2 |
0.80:1 |
1.16:1 |
1.21:1 |
1.26:1 |
|
G:F, kg:kg |
0.43 |
0.46 |
0.48 |
0.50 |
|
STTD Ca |
0.09 |
0.38 |
0.52 |
0.67 |
|
STTD Ca:STTD P |
0.60:1 |
1.23:1 |
1.33:1 |
1.43:1 |
|
Bone ash, g |
14.3 |
21.3 |
23.2 |
24.0 |
|
STTD Ca |
0.43 |
0.56 |
0.63 |
0.69 |
|
STTD Ca:STTD P |
2.87:1 |
1.81:1 |
1.62:1 |
1.47:1 |
1The amount of STTD Ca needed to attain the predicted maximum value.
2The STTD Ca:STTD P ratio corresponding to the amount of STTD Ca needed to attain the predicted maximum value.
This report is based on unpublished research by Caroline González-Vega, Carrie Walk, Michael Murphy, and Hans H. Stein.