Whole soybeans, from which the oil is not extracted, are referred to as full-fat soybeans (FFSB) and may be used in diets for poultry and pigs because of it is high contents of protein, oil, linoleic acid, vitamin E, and lecithin. Unprocessed raw soybeans, however, contain several anti-nutritional factors including trypsin inhibitors that make them unsuitable as a feed for pigs and poultry, because the protein digesting enzymes are impaired by the trypsin inhibitors, which reduces digestibility, depresses growth rate, and decreases the efficiency of feed utilization when fed to swine. However, there is a lack of data for the nutritional value of FFSB. Therefore, two experiments were conducted to test the hypothesis that there is no difference among FFSB sources 01, 02, 03, 04, and 05 in the digestible energy (DE), the metabolizable energy (ME), and the standardized total tract digestibility (STTD) of P when fed to growing pigs.
Whole soybeans, from which the oil is not extracted, are referred to as full-fat soybeans (FFSB) and may be used in diets for poultry and pigs because of it is high contents of protein, oil, linoleic acid, vitamin E, and lecithin. Unprocessed raw soybeans, however, contain several anti-nutritional factors including trypsin inhibitors that make them unsuitable as a feed for pigs and poultry, because the protein digesting enzymes are impaired by the trypsin inhibitors, which reduces digestibility, depresses growth rate, and decreases the efficiency of feed utilization when fed to swine. However, there is a lack of data for the nutritional value of FFSB. Therefore, two experiments were conducted to test the hypothesis that there is no difference among FFSB sources 01, 02, 03, 04, and 05 in the digestible energy (DE), the metabolizable energy (ME), and the standardized total tract digestibility (STTD) of P when fed to growing pigs.
In experiment 1, 48 growing pigs (initial body weight: 30.86 ± 1.64 kg) were allotted to six diets using a randomized complete block design with eight replicate pigs per diet. A basal diet based on corn as the only energy source was formulated and five diets contained corn and each source of FFSB were formulated as well. In Experiment 2, 80 pigs (initial body weight: 16.73 ± 3.16 kg) were allotted to a randomized complete block design with 10 diets and 8 replicate pigs per diet. Five diets containing each source of FFSB as the only source of P were formulated. Five additional diets were formulated by adding 1,000 FTU/kg of microbial phytase to the original five diets. In both experiments, all diets were fed in meal form and pigs were limit fed at 3.2 times the energy requirement for maintenance (i.e., 197 kcal/kg × body weight0.60). Daily allowance was provided each day in 2 equal meals at 0800 and 1700 h. Throughout the experiments, pigs had free access to water.
In experiment 1, feed consumption was recorded daily, and pigs were fed experimental diets for 13 d. The initial seven days were considered the adaptation period to the diet. Fecal samples were collected for four days according to the marker-to-marker approach (Adeola, 2001). In experiment 2, feed consumption was recorded daily, and diets were fed for 12 days. The initial five days were considered the adaptation period to the diet, whereas fecal materials were collected from the feed provided during the following four days. `
Results demonstrated that ME in corn was 3,759 kcal per kg dry matter (DM), and FFSB 01, 02, 03, 04, and 05 contained 4,957, 4,744, 4,920, 4,825, and 5,071 kcal ME per kg DM, respectively (Fig. 1). The ME in FFSB source 05 was greater (P < 0.05) than the ME in FFSB source 02 or 04. However, the DE and ME in all sources of FFSB were greater (P < 0.05) than in corn. There were no differences in DE:GE, ME:DE, or ME:GE among the five sources of FFSB or between FFSB sources and corn.
Results from Exp. 2 demonstrated that were no interactions between use of phytase and source of FFSB, and no effects of use of phytase or source of FFSB were observed for feed intake, weight of feces excreted, or daily basal endogenous P loss (Table 1). The ATTD and the STTD of P in diets with FFSB source 05 was greater (P < 0.05) than the ATTD and STTD of P in other FFSB sources if no phytase was used, but if phytase was added to the diets, no differences among the five sources of FFSB were observed (interaction, P < 0.05). However, the ATTD and STTD of P was greater (P < 0.05) if phytase was used than if no phytase was used.

In conclusion, results demonstrated that concentrations of phytate and minerals varied slightly among the five sources of FFSB used in the experiment. The high ME in FFSB will result in diets containing FFSB having greater DE and ME than diets based on soybean meal. Pigs consuming diets without FFSB, therefore, will consume more ME than pigs consuming diets without FFSB, which may be beneficial for younger pigs and lactating sows. Results also demonstrated that FFSB source 05 had greater STTD of P than the other sources of FFSB if no microbial phytase was used, but if microbial phytase was added to the diets, no differences among growing regions were observed. However, regardless of growing region, the STTD of P in FFSB was increased if microbial phytase was used.
Table 1. Effects of microbial phytase on apparent total tract digestibility (ATTD) and standardized total tract digestibility (STTD) of P in five sources of FFSB1 (Exp. 2)
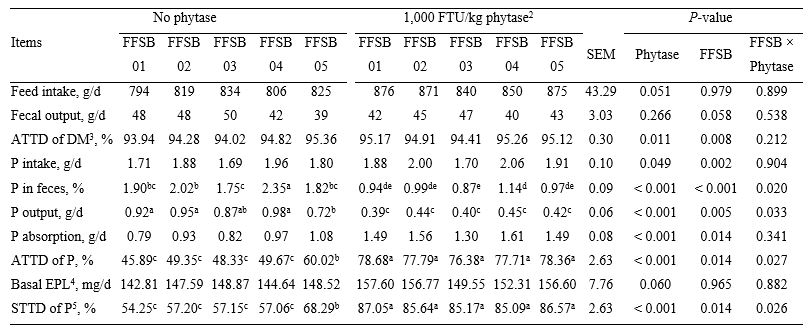
a-bWithin a row, means without a common superscript differ (P < 0.05).
1Each least squares mean is the mean of 8 observations, except for diets containing FFSB from IL and without phytase (n = 7) and Full-fat soybean meal (FFSB) from OH without phytase (n = 6).
2Phytase: Quantum Blue 5000 (ABvista, Marlborough, UK).
3DM = dry matter.
4EPL = endogenous P loss. This value was estimated to be at 190 mg per kg of dry matter intake (NRC, 2012). The daily basal EPL (mg/d) for each diet was calculated by multiplying the EPL (mg per kg of the dry matter intake) by the daily intake in dry matter of each diet.
5Values for STTD were calculated by correcting values for ATTD for basal endogenous losses (NRC, 2012)