Protein and amino acids quality in feed ingredient is most correctly evaluated by determining the standardized ileal digestibility (SID) of crude protein (CP) and amino acids. Experiments to determine the SID of CP and amino acids in feed ingredients often utilize semi-synthetic diets that contain the test ingredient as the sole source of CP and amino acids. Therefore, the CP and amino acid supply from experimental diets do not always meet the requirement for standardized ileal digestible amino acids by pigs and, therefore, pig growth is often limited in these experiments.
Crystalline amino acids are believed to be rapidly absorbed and 100% digestible. Addition of crystalline amino acids to diets during the adaptation or collection phase is, therefore, believed not to influence values for SID of amino acids in the test feed ingredient, but this has not been experimentally verified. Therefore, an experiment was conducted to test the hypothesis that addition of crystalline amino acids to diets during the adaptation or collection periods of digestibility studies will not influence calculated values for SID of CP and amino acids in corn and soybean meal.
Animals, Housing, Experimental design, and diets
Seven growing barrows (77.90 ± 2.60 kg) had a T-cannula installed in the distal ileum for collection of ileal digesta. Pigs were housed in individual pens (1.2 × 1.5 m) in an environmentally controlled room. Pens had smooth, plastic-coated sides and fully-slatted tribar metal floors. Each pen contained a feeder and a nipple drinker. Pigs were randomly allotted to a 7 × 7 Latin square design with 7 treatments and seven 7-day periods in each square. Therefore, there were a total of 7 observations per treatment.
Two diets containing corn or soybean meal were formulated (Tables 1 and 2). The diet containing soybean meal met amino acids requirements for 75 to 100 kg growing pigs, but the corn diet provided amino acids below the requirement. Two additional diets containing corn with crystalline amino acids or soybean meal with crystalline amino acids were also formulated. The same quantities of crystalline amino acids were added to both diet resulting in the corn diet with crystalline amino acids meeting the requirement for amino acids, whereas the soybean meal diet with crystalline amino acids provided amino acids above the requirement. An N-free diet was used to determine endogenous losses of amino acids and crude protein.
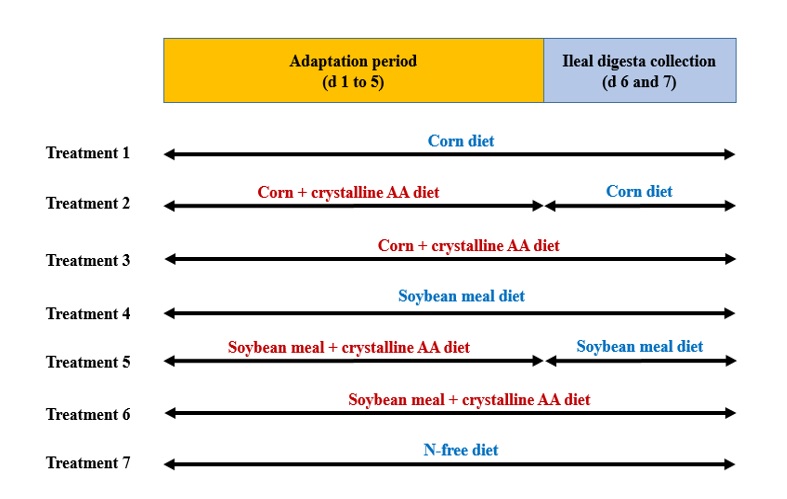
The 7 experimental treatments were: 1) corn diet fed for all 7 days, 2) corn and crystalline amino acids diet fed for the initial 5 days (i.e., adaptation period) and the corn diet fed on day 6 and 7 (i.e., collection period), 3) corn and crystalline amino acid diet fed for all 7 days, 4) soybean meal diet fed for all 7 days, 5) soybean meal and crystalline amino acids diet fed during adaption and the soybean meal diet fed during collection, 6) soybean meal and crystalline amino acid diet fed for all 7 days, and 7) N-free diet fed for all 7 days (Figure 1).
Pigs were fed 3 times the maintenance energy requirement (i.e., 197 kcal ME per kg BW0.6). The initial 5 days of each period was considered the adaptation phase to the diets and ileal digesta were collected on days 6 and 7 for 8 h per day.
Values for SID of CP and amino acids were calculated using 2 calculation procedures. First, values were calculated using the analyzed CP, amino acids, and chromium values in the experimental diets that were fed during the collection phase, i. e., corn diet without or with crystalline amino acids or the soybean meal diet without or with crystalline amino acids. However, values for SID of CP and amino acids were also calculated using only the analyzed chemical composition of the corn diet for all the corn treatments and only the analyzed chemical composition of the soybean meal diet for all the soybean meal treatments.
Results
For both corn and soybean meal, the SID of CP and amino acids was not influenced by the inclusion of crystalline amino acids in the diets fed during the adaptation period (Table 3). The SID of Ile, Lys, Met, Phe, Trp, and the mean of indispensable amino acids in corn was greater (P < 0.05) if crystalline amino acids were fed for all 7 days than if the amino acids were provided only during the adaptation period, and the SID of Ile, Thr, and Val was greater (P < 0.05) if crystalline amino acids were fed during the entire 7-d period than if no crystalline amino acids were used. However, for soybean meal, SID values were not influenced by inclusion of crystalline amino acids regardless of the timing of the inclusion.
The values for SID of CP and amino acids in corn or soybean meal treatments were also calculated using only the analyzed chemical composition of the ingredient disregarding the crystalline amino acids in the diets. Using this calculation procedure resulted in no differences being detected among the SID of CP and amino acids in corn treatments or the SID of CP and amino acids in soybean meal treatments (Table 4). These results demonstrate that crystalline amino acids are indeed 100% absorbed in the small intestine of pigs.
Key points
- Crystalline amino acids were 100% absorbed, therefore, they had no influence on the concentration of amino acids in the digesta collected at the distal ileum and values for SID were not affected by crystalline amino acids, if they were disregarded from the calculation of values for SID of CP and amino acids in corn and soybean meal.
- Crystalline amino acids may be added to diets used in digestibility experiments in pigs without affecting results, and therefore, amino acids deficiency may be avoided.
Table 1. Ingredient composition of experimental diets (as-fed basis)
|
Ingredient, %
|
Corn |
Corn + amino acids |
Soybean meal |
Soybean meal + amino acids |
N-Free |
|
Ground corn |
93.40 |
93.40 |
- |
- |
- |
|
SBM, 48% CP |
- |
- |
36.00 |
36.00 |
- |
|
Ground limestone |
1.00 |
1.00 |
0.80 |
0.80 |
0.45 |
|
Dicalcium phosphate |
0.70 |
0.70 |
0.60 |
0.60 |
1.60 |
|
Sodium chloride |
0.40 |
0.40 |
0.40 |
0.40 |
0.40 |
|
Chromic oxide |
0.40 |
0.40 |
0.40 |
0.40 |
0.10 |
|
Soybean oil |
- |
- |
3.0 |
3.0 |
4.00 |
|
Vitamin-mineral premix1 |
0.30 |
0.30 |
0.30 |
0.30 |
0.30 |
|
Corn starch |
3.80 |
0.08 |
58.50 |
54.78 |
68.35 |
|
Sucrose |
- |
- |
- |
- |
20.00 |
|
L-Lys HCL |
- |
0.70 |
- |
0.70 |
- |
|
DL-Met |
- |
0.08 |
- |
0.08 |
- |
|
L-Thr |
- |
0.25 |
- |
0.25 |
- |
|
L-Trp |
- |
0.10 |
- |
0.10 |
- |
|
L-His |
- |
0.06 |
- |
0.06 |
-- |
|
L-Val |
- |
0.18 |
- |
0.18 |
- |
|
L-Ile |
- |
0.17 |
- |
0.17 |
- |
|
L-Phe |
- |
0.18 |
- |
0.18 |
- |
|
Glu |
- |
2.00 |
- |
2.00 |
- |
|
Potassium carbonate |
- |
- |
- |
- |
0.40 |
|
Magnesium oxide |
- |
- |
- |
- |
0.10 |
|
Solka floc |
- |
- |
- |
- |
4.00 |
1The vitamin-micromineral premix provided the following quantities of vitamins and micro minerals per kilogram of complete diet: vitamin A as retinyl acetate, 11,136 IU; vitamin D3 as cholecalciferol, 2,208 IU; vitamin E as DL-alpha tocopheryl acetate, 66 IU; vitamin K as menadione dimethylprimidinol bisulfite, 1.42 mg; thiamin as thiamine mononitrate, 0.24 mg; riboflavin, 6.59 mg; pyridoxine as pyridoxine hydrochloride, 0.24 mg; vitamin B12, 0.03 mg; D-pantothenic acid as D-calcium pantothenate, 23.5 mg; niacin, 44.1 mg; folic acid, 1.59 mg; biotin, 0.44 mg; Cu, 20 mg as copper sulfate and copper chloride; Fe, 126 mg as ferrous sulfate; I, 1.26 mg as ethylenediamine dihydriodide; Mn, 60.2 mg as manganese sulfate; Se, 0.3 mg as sodium selenite and selenium yeast; and Zn, 125.1 mg as zinc sulfate.
|
Item, % |
Corn |
Corn + amino acids |
Soybean meal |
Soybean meal + amino acids |
N-free |
|
DM |
88.05 |
88.51 |
90.06 |
90.21 |
91.45 |
|
CP |
7.06 |
11.01 |
19.68 |
22.47 |
0.71 |
|
Indispensable amino acids |
|||||
|
Arg |
0.30 |
0.30 |
1.25 |
1.19 |
0.02 |
|
His |
0.18 |
0.26 |
0.47 |
0.51 |
0.01 |
|
Ile |
0.22 |
0.37 |
0.85 |
1.00 |
0.02 |
|
Leu |
0.70 |
0.71 |
1.37 |
1.30 |
0.04 |
|
Lys |
0.23 |
0.77 |
1.13 |
1.57 |
0.02 |
|
Met |
0.13 |
0.17 |
0.24 |
0.28 |
0.01 |
|
Phe |
0.29 |
0.44 |
0.90 |
1.07 |
0.02 |
|
Thr |
0.23 |
0.40 |
0.68 |
0.91 |
0.02 |
|
Trp |
0.06 |
0.16 |
0.27 |
0.37 |
0.01 |
|
Val |
0.31 |
0.51 |
0.88 |
1.02 |
0.03 |
|
Dispensable amino acids |
|||||
|
Ala |
0.44 |
0.45 |
0.77 |
0.73 |
0.03 |
|
Asp |
0.42 |
0.42 |
2.01 |
1.87 |
0.04 |
|
Cys |
0.14 |
0.15 |
0.26 |
0.24 |
0.01 |
|
Glu |
1.08 |
1.09 |
3.26 |
3.07 |
0.08 |
|
Gly |
0.27 |
2.14 |
0.79 |
2.65 |
0.03 |
|
Pro |
0.52 |
0.5 |
0.89 |
0.78 |
0.03 |
|
Ser |
0.28 |
0.26 |
0.82 |
0.72 |
0.02 |
|
|
Corn |
Soybean meal |
|
P- values |
||||||
|
Item, % |
No amino acids |
Amino acids in adaptation |
Amino acids in 7 days |
No amino acids |
Amino acids in adaptation |
Amino acids in 7 days |
SEM |
Ingredient |
Amino acids |
Ingredient × amino acids |
|
CP |
88.0a |
90.3a |
94.6a |
92.4a |
90.1a |
91.7a |
2.78 |
0.836 |
0.361 |
0.296 |
|
Indispensable amino acids |
||||||||||
|
Arg |
97.1a |
98.1a |
98.1a |
97.2a |
95.3a |
95.5a |
1.96 |
0.201 |
0.953 |
0.609 |
|
His |
91.1a |
93.0a |
92.9a |
93.6a |
91.5a |
92.5a |
1.08 |
0.805 |
0.902 |
0.147 |
|
Ile |
85.5b |
86.1b |
91.0a |
90.3a |
88.7ab |
90.8a |
1.55 |
0.053 |
0.052 |
0.241 |
|
Leu |
91.1a |
89.2a |
90.7a |
90.3a |
88.6a |
88.5a |
1.35 |
0.242 |
0.337 |
0.765 |
|
Lys |
88.6c |
90.0bc |
96.1a |
94.4a |
93.0ab |
95.0a |
1.15 |
0.007 |
0.001 |
0.015 |
|
Met |
90.6ab |
88.3b |
92.4a |
91.5a |
90.1ab |
91.9a |
1.21 |
0.433 |
0.044 |
0.598 |
|
Phe |
89.1ab |
85.9b |
92.1a |
90.1ab |
88.6ab |
90.7ab |
1.85 |
0.598 |
0.084 |
0.514 |
|
Thr |
83.8b |
85.2ab |
91.3a |
88.6ab |
86.2ab |
90.1ab |
2.61 |
0.453 |
0.096 |
0.463 |
|
Trp |
79.6c |
84.8bc |
92.2a |
90.3ab |
88.2ab |
91.8a |
1.98 |
0.011 |
0.005 |
0.029 |
|
Val |
84.5b |
85.0ab |
90.6a |
89.0ab |
87.0ab |
89.1ab |
2.02 |
0.265 |
0.113 |
0.276 |
|
Mean |
89.3ab |
87.5b |
92.9a |
91.9a |
90.1ab |
91.7ab |
1.73 |
0.300 |
0.094 |
0.390 |
|
Dispensable amino acids |
||||||||||
|
Ala |
88.8a |
88.9a |
89.6a |
88.0a |
85.8a |
85.8a |
2.02 |
0.104 |
0.837 |
0.710 |
|
Asp |
86.3a |
85.4a |
85.9a |
89.2a |
86.5a |
86.7a |
2.26 |
0.317 |
0.615 |
0.845 |
|
Cys |
89.2a |
85.5ab |
87.8ab |
86.6ab |
83.6ab |
83.2b |
2.23 |
0.077 |
0.229 |
0.785 |
|
Glu |
90.4a |
89.2a |
89.6a |
91.0a |
87.5a |
87.7a |
1.62 |
0.440 |
0.247 |
0.680 |
|
Gly |
97.9bc |
113.3a |
101.0b |
96.2bc |
89.6c |
97.2bc |
4.25 |
0.003 |
0.469 |
0.010 |
|
Pro |
122.3b |
175.4a |
162.2ab |
145.8ab |
139.6b |
150.5ab |
14.59 |
0.454 |
0.137 |
0.078 |
|
Ser |
89.4a |
86.5a |
88.5a |
90.6a |
88.6a |
87.8a |
2.54 |
0.593 |
0.457 |
0.776 |
|
Mean |
95.6ab |
103.9a |
101.4ab |
96.2ab |
92.6b |
94.6b |
3.50 |
0.021 |
0.664 |
0.122 |
|
All amino acids |
92.8a |
96.4a |
97.6a |
94.1a |
91.4a |
93.2a |
2.57 |
0.125 |
0.631 |
0.253 |
1Data are least squares means of 7 observations for each treatment.
2Standardized ileal digestibility values were calculated by correcting values for apparent ileal digestibility for the basal ileal endogenous losses. Basal ileal endogenous losses were determined as (g/kg of DMI): CP, 20.64; Arg, 0.71; His, 0.16; Ile, 0.28; Leu, 0.44; Lys, 0.27; Met, 0.08; Phe, 0.30; Thr, 0.55; Trp, 0.13; Val, 0.38; Ala, 0.61; Asp, 0.75; Cys, 0.21; Glu, 0.92; Gly, 1.87; Pro, 8.25; and Ser, 0.56.
Table 4. Standardized ileal digestibility (%) of crude protein (CP) and amino acids in corn and soybean meal calculated based on CP and amino acids in the diets without crystalline amino acids1
|
|
Corn |
Soybean meal |
|
P- values |
||||||
|
Item, % |
No amino acids |
Amino acids in adaptation |
Amino acids in 7 days |
No amino acids |
Amino acids in adaptation |
Amino acids in 7 days |
SEM |
Ingredient |
Amino acids |
Ingredient × amino acids |
|
CP |
88.1a |
90.3a |
92.9a |
92.4a |
90.1a |
91.5a |
2.90 |
0.647 |
0.637 |
0.459 |
|
Indispensable amino acids |
||||||||||
|
Arg |
97.1a |
98.1a |
99.1a |
97.2a |
95.3a |
96.2a |
1.94 |
0.172 |
0.841 |
0.572 |
|
His |
91.1a |
93.0a |
90.7a |
93.6a |
91.5a |
92.5a |
1.14 |
0.287 |
0.756 |
0.171 |
|
Ile |
85.7ab |
83.9b |
86.6ab |
90.3a |
88.7a |
90.0a |
1.87 |
0.005 |
0.414 |
0.892 |
|
Leu |
91.0a |
89.2a |
91.3a |
90.3a |
88.6a |
89.9a |
1.33 |
0.356 |
0.259 |
0.934 |
|
Lys |
88.6b |
88.0b |
88.3b |
94.4a |
93.0a |
93.6a |
1.65 |
<.001 |
0.778 |
0.956 |
|
Met |
90.6ab |
88.3b |
90.6ab |
91.5a |
90.1ab |
91.1ab |
1.24 |
0.274 |
0.209 |
0.839 |
|
Phe |
89.2a |
85.9a |
89.0a |
90.1a |
88.6a |
89.7a |
1.90 |
0.331 |
0.343 |
0.821 |
|
Thr |
83.9a |
85.1a |
86.5a |
88.6a |
86.2a |
88.0a |
2.72 |
0.240 |
0.799 |
0.713 |
|
Trp |
79.9b |
81.0b |
80.1b |
90.3a |
88.2a |
89.5a |
2.48 |
<.001 |
0.974 |
0.760 |
|
Val |
84.7ab |
82.8b |
85.6ab |
89.0a |
87.0ab |
88.3a |
2.27 |
0.029 |
0.484 |
0.895 |
|
Mean |
89.3ab |
87.5b |
90.0ab |
91.9a |
90.1ab |
91.2ab |
1.78 |
0.106 |
0.395 |
0.891 |
|
Dispensable amino acids |
||||||||||
|
Ala |
88.8a |
88.9a |
90.5a |
88.0a |
85.8a |
87.7a |
1.98 |
0.257 |
0.145 |
0.639 |
|
Asp |
86.3a |
85.4a |
87.3a |
89.2a |
86.5a |
88.5a |
2.24 |
0.170 |
0.272 |
0.528 |
|
Cys |
89.2a |
85.5a |
88.4a |
86.6a |
83.6a |
85.7a |
2.19 |
0.274 |
0.149 |
0.208 |
|
Glu |
90.4a |
89.2a |
90.3a |
91.0a |
87.5a |
89.2a |
1.59 |
0.807 |
0.558 |
0.277 |
|
Gly |
98.4ab |
105.5a |
104.7ab |
96.2ab |
89.6b |
92.2ab |
5.96 |
0.001 |
0.024 |
0.973 |
|
Pro |
122.4c |
175.4a |
162.9ab |
145.8abc |
139.6bc |
146.4abc |
14.22 |
0.280 |
0.352 |
0.136 |
|
Ser |
89.3a |
86.5a |
90.6a |
90.6a |
88.6a |
90.2a |
2.48 |
0.470 |
0.549 |
0.316 |
|
Mean |
95.7abc |
103.9a |
103.3ab |
96.2abc |
92.6c |
94.9bc |
3.67 |
0.015 |
0.560 |
0.132 |
|
All amino acids |
92.9a |
96.4a |
97.3a |
94.1a |
91.4a |
93.2a |
2.68 |
0.146 |
0.722 |
0.293 |
a-cValues within a row lacking a common superscript letter are different (P < 0.05).
1Data are least squares means of 7 observations for each treatment.
2Standardized ileal digestibility values were calculated by correcting values for apparent ileal digestibility for the basal ileal endogenous losses. Basal ileal endogenous losses were determined as (g/kg of DMI): CP, 20.64; Arg, 0.71; His, 0.16; Ile, 0.28; Leu, 0.44; Lys, 0.27; Met, 0.08; Phe, 0.30; Thr, 0.55; Trp, 0.13; Val, 0.38; Ala, 0.61; Asp, 0.75; Cys, 0.21; Glu, 0.92; Gly, 1.87; Pro, 8.25; and Ser, 0.56.
Figure 1. Feeding treatments of pigs fed experimental diets