Values for digestibility of nutrients in diets or feed ingredients fed to pigs are determined by nutrient intake and nutrient excretion in feces or ileal digesta. Ileal nutrient digestibility is determined using an indigestible marker because complete quantitative collection of ileal digesta is usually not possible. As a consequence, analysis of marker concentration in digesta is critical for accurate calculation of digestibility coefficients. Therefore, a sufficient adaptation period before initiation of ileal digesta collection is also important to make sure that the concentration of the marker in digesta is constant. It is, however, not known if the adaptation period is different among different markers. Therefore, an experiment was conducted to test the hypothesis that adaptation is needed to have constant marker concentrations in ileal digesta from pigs. The second objective was to test the null-hypothesis that apparent ileal digestibility (AID) and standardized ileal digestibility (SID) of AA digestibility and the basal endogenous losses of AA are constant regardless of the indigestible marker used.
Experimental design
Eight barrows with an initial BW of 58.1 ± 4.3 kg that had a T-cannula installed in the distal ileum were randomly allotted to a 2-period crossover design with 2 diets and 4 pigs per diet in each period. A soybean meal-based diet and an N-free diet were prepared. Both experimental diets contained 0.4% Cr2O3 (chromic oxide), 0.4% TiO2 (titanium dioxide), and 0.4% Celite (source of acid insoluble ash, AIA) to provide indigestible markers. A washout diet with no exogenous indigestible marker was also prepared based on corn, distillers dried grains with solubles, and casein and was fed to pigs between the 2 periods. Water was available at all times throughtout the experiment.
Each experimental period lasted 9 days and ileal digesta samples were collected from 0800 to 2000 h on each day during each of the 2 collection periods. Marker concentrations in ileal digesta were analyzed separately for each day, and the point where the concentration of each marker was stabilized in the digesta was determined using the broken-line analysis. The basal endogenous losses, AID, and SID of AA were calculated based on concentrations of markers and AA in ileal digesta.
Results
For pigs fed the soybean meal diet, the breakpoints for Cr, Ti, and AIA in ileal digesta were 2.70, 2.45, and 3.77 d, respectively (Fig. 1). In pigs fed the N-free diet, the breakpoints for Cr, Ti, and AIA in ileal digesta were 2.52, 2.39, and 2.29 d, respectively. These results demonstrate that an adaptation period of at least 4 days is needed in studies where ileal digestibility markers are used.
Data for the digestibility of AA in soybean meal and for the basal endogenous losses of AA were pooled from d 5 to 9 to determine the influence of indigestible marker on digestibility and basal endogenous losses of AA. A similar calculation was used to for pooled digesta from d 6 and 7.
Based on the pooled data from d 5 to 9, the basal endogenous losses of most AA calculated using Cr as a digestibility marker were less (P < 0.05) than the basal endogenous loss values calculated using Ti (Table 1). However, the basal endogenous losses of most AA calculated using Cr were greater (P < 0.05) compared with values calculated using AIA. Basal endogenous losses of most AA calculated for d 6 and 7 were greatest (P < 0.05) if Ti was used as the marker and least if AIA was used with values obtained with Cr as the marker being intermediate.
During the 5 to 9 d period, the AID and SID of all indispensable AA calculated using Cr or Ti as the digestibility marker were greater (P < 0.05) than the digestibility values calculated using AIA, but there were no differences between values calculated using Cr and Ti. The AID and SID of all AA except Tyr calculated for d 6 and 7 using Cr or Ti as the digestibility marker were also greater (P < 0.05) than the digestibility values calculated using AIA, but there were no differences between the values calculated using Cr and Ti.
Key points
- An adaptation period of at least 3 d is required before ileal digestibility markers are stabilized in the ileal outflow if Cr or Ti is used as an indigestible marker and at least 4 d of adaptation is required if AIA is the marker.
- Values for AA digestibility in soybean meal fed to growing pigs calculated using Cr or Ti were not different, but greater than values calculated based on AIA.
- Based on results from the present experiment it is recommended that Cr or Ti are used as indigestible markers in experiments to determine AID and SID of AA.
Table 1. Basal endogenous losses of AA and AID and SID of AA in soybean meal determined using different indigestible markers using the data collected from d 5 to 9 or from d 6 to 7 of pigs
|
Item |
Pooled data collected from d 5 to 9 |
|
Pooled data collected from d 6 to 7 |
||||||||
|---|---|---|---|---|---|---|---|---|---|---|---|
|
Cr |
Ti |
AIA |
SEM |
P |
|
Cr |
Ti |
AIA |
SEM |
P |
|
|
Basal endogenous losses of AA (g/kg DMI) |
|||||||||||
|
Lys |
0.25b |
0.31a |
0.19c |
0.04 |
< 0.001 |
|
0.24b |
0.29a |
0.15c |
0.03 |
< 0.001 |
|
Met |
0.06ab |
0.07a |
0.05b |
0.02 |
0.001 |
|
0.06a |
0.07a |
0.04b |
0.01 |
< 0.001 |
|
Thr |
0.51b |
0.62a |
0.36c |
0.07 |
< 0.001 |
|
0.52b |
0.65a |
0.34c |
0.16 |
< 0.001 |
|
Trp |
0.14b |
0.18a |
0.10c |
0.02 |
< 0.001 |
|
0.15b |
0.18a |
0.10c |
0.02 |
< 0.001 |
|
AID of AA, % |
|||||||||||
|
Lys |
88.9a |
89.5a |
81.3b |
2.8 |
0.001 |
|
87.1a |
88.1a |
73.4b |
3.9 |
0.009 |
|
Met |
90.1a |
90.7a |
83.4b |
2.3 |
0.004 |
|
88.6a |
89.4a |
76.1b |
3.6 |
0.021 |
|
Thr |
80.6a |
81.7a |
68.2b |
3.7 |
0.003 |
|
79.2a |
80.6a |
56.3b |
6.5 |
0.015 |
|
Trp |
82.0a |
83.0a |
70.6b |
3.5 |
0.003 |
|
81.7a |
82.9a |
60.8b |
6.2 |
0.016 |
|
SID of AA, % |
|||||||||||
|
Lys |
91.3a |
92.7a |
83.3b |
2.8 |
< 0.001 |
|
89.6a |
91.2a |
75.4b |
3.9 |
0.005 |
|
Met |
91.9a |
93.2a |
85.1b |
2.3 |
0.002 |
|
90.5a |
91.9a |
77.8b |
3.6 |
0.016 |
|
Thr Trp |
86.8a 87.7a |
89.8a 90.3a |
73.3b 75.1b |
3.7 3.5 |
< 0.001 < 0.001 |
|
85.4a 87.4a |
88.7a 90.2a |
61.4b 65.3b |
6.5 6.2 |
0.007 0.008 |
|
Trp |
87 |
90. |
75. |
3.5 |
|
|
87. |
90 |
65. |
6.2 |
0.0 |
a-cWithin a row, mean within a common superscript differ (P < 0.05).
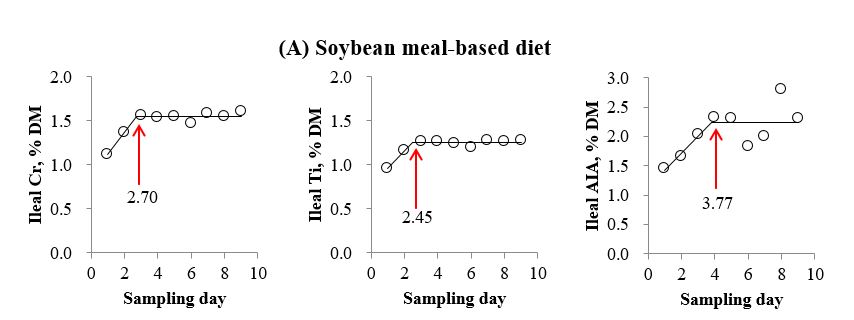
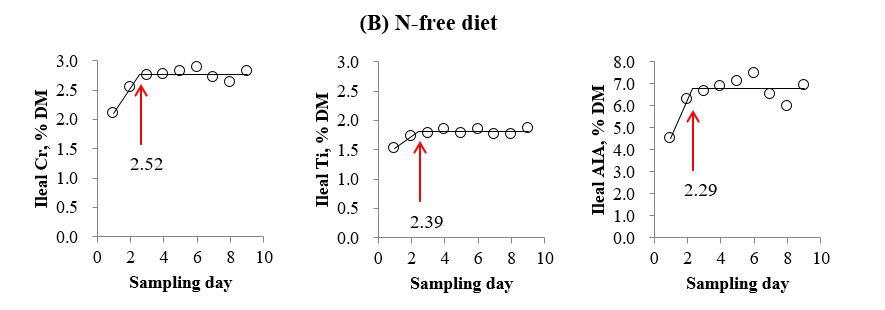
Fig. 1. (A) Soybean meal-based diet: the breakpoint for Cr, Ti, and AIA was 2.70 (SE = 0.6, P < 0.001), 2.45 (SE = 0.4, P < 0.001), and 3.77 d (SE = 1.8, P = 0.091), respectively. (B) N-free diet: the breakpoint for Cr, Ti, and AIA was 2.52 (SE = 0.60, P = 0.001), 2.39 (SE = 0.51, P = 0.002), and 2.29 d (SE = 0.58, P = 0.021), respectively.