Corn coproducts produced from the fuel ethanol or the wet milling industries may be used in diets for pigs. Different technologies are used to develop high protein corn co-products, but in addition to providing amino acids to the diets, high protein corn co-products also provide energy to the diets. The energy concentrations in corn protein may depend on the concentrations of fat, carbohydrates, and protein in sources of corn protein. Newly developed corn proteins contain 40 to 50% crude protein. There are, however, limited data on how differences in the chemical composition of different sources of corn protein influence the concentrations of digestible energy (DE) and metabolizable energy (ME) when fed to weanling pigs. Therefore, the objective of this experiment was to test the null hypothesis that there is no difference in the apparent total tract digestibility (ATTD) of gross energy (GE) and concentrations of DE and ME among 3 sources of corn protein when fed to weanling pigs.
Experimental design
A total of 32 barrows (initial BW: 18.0 kg; SD = 1.2 kg) were randomly allotted to one of the 4 diets. Therefore, there were 8 replicate pigs per diet. Three sources of corn protein were procured: 1) new corn protein, 2) ANDVantage 50 Y, and 3) ANDVantage 40 Y (Table 1). ANDVantage 50 Y and ANDVantage 40 Y were sourced from The Andersons Inc., Wichita, KS. Four diets were formulated. The basal diet without corn protein contained corn as a sole source of energy. Three additional diets were formulated to include corn and each source of corn protein.
Feed provisions were recorded daily and diets were fed for 12 days. The initial 5 days were considered the adaptation period to the diet, and urine and fecal materials were collected from feed provided during the following 4 days using the marker to marker procedure. Urine was collected in urine buckets over a preservative of 50 mL of HCl. Fecal samples and 20% of the collected urine were stored at – 20 °C immediately after collection.
The ATTD of GE and dry matter (DM) was calculated for each diet, and concentrations of DE and ME in each diet were calculated as well. The DE and ME in the basal diet containing corn as a sole source of energy were divided by the inclusion rate (i.e. 96.8%) to calculate the DE and ME in corn. The contribution of DE and ME from corn to DE and ME in the 3 test diets containing corn and the 3 corn protein sources were subtracted from the DE and ME of each diet, and the DE and ME in corn protein were calculated by difference.
Results
Concentrations of acid hydrolyzed ether extract in new corn protein, ANDVantage 50 Y, and ANDVantage 40 Y were 3.14, 9.90, and 8.73%, respectively. Concentrations of GE in new corn protein, ANDVantage 50 Y, and ANDVantage 40 Y were 5,033, 5,284, and 4,813 kcal/kg. With similar concentrations of insoluble dietary fiber, new corn protein contained less soluble dietary fiber compared with ANDVantage 50 Y. ANDVantage 40 Y contained approximately 44% total dietary fiber, which was greater than that in new corn protein and ANDVantage 50 Y.
On an as-is basis, concentration of DE in ANDVantage 50 Y was greater (P < 0.05) than in the other sources, followed by new corn protein, ANDVatage 40 Y, and corn (Table 2). The ME in ANDVantage 50 Y was greater (P < 0.05) than in corn and ANDVantage 40 Y, but ME did not differ between new corn protein and ANDVantage 50 Y or between corn and ANDVantage 40 Y. On a DM basis, concentrations of DE and ME in ANDVantage 50 Y were the greatest (P < 0.05) among all feed ingredients, but DE and ME on a DM basis were not different between new corn protein and ANDVantage 40 Y.
Key points
- On a DM basis, ANDVantage 50 Y contained more DE and ME than new corn protein, corn and Andvantage 40 Y.
- Andvantage 40 Y contained DE and ME (DM basis) that were not different from the DE and ME in corn or corn protein.
Table 1. Nutrient composition of feed ingredient (as-is basis)
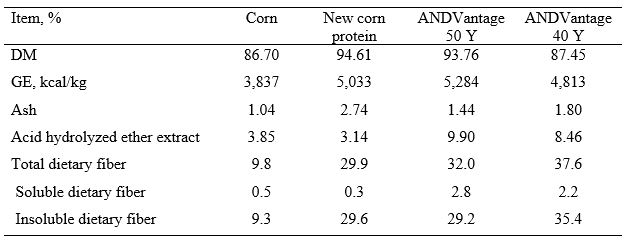
Table 2. Concentrations of DE and ME in corn and 3 sources of corn protein1

a-dWithin a row, means without a common superscript differ (P < 0.05).
1Each least squares mean is the mean of 8 observations, respectively, except for diets containing new corn protein and ANDVantage 40 Y.