Most of the P in corn and soybean meal (SBM) is stored as phytate. Phytase consists of one hydroxylated inositol ring with six phosphate groups. Therefore, phytase is often included at a standard level of 500 units (FTU) per kg in swine diets to increase the release of P from phytate. However, greater concentrations of phytase in diets for pigs may benefit growth and feed efficiency, which is likely a result of the inositol that is also released and can be absorbed by pigs. Inositol is believed to increase growth of animals by stimulating protein accretion. Inositol also improves gut health of pigs by enhancing intestinal epithelial cell functions. However, data from recent research demonstrated that weaning pigs at around 21 days of age results in a dramatic drop in plasma inositol and it is not until 6 weeks post-weaning that pigs will regain preweaning levels of inositol. Therefore, an experiment was conducted to test the hypothesis that microbial phytase will release sufficient inositol from corn and SBM and other ingredients in diets for newly weaned pigs to maintain pre-weaning levels of plasma inositol throughout the post-weaning phase and that this will result in improved growth performance of pigs.
Experimental design
A three-phase feeding program was used with day 1 to 14 as phase 1, day 15 to 28 as phase 2, and day 29 to 42 as phase 3. There were three dietary treatments containing corn and SBM and three levels of supplemental phytase (i.e., 0, 1,000, and 2,000 FTU/kg diet). The diet without phytase was the positive control and contained Ca and P at the requirements for pigs (NRC, 2012). The two treatment diets with phytase contained 0.08% digestible P and 0.12% total Ca less than the requirements to account for the expected release of P and Ca by phytase.
A total of 150 newly weaned pigs with an initial body weight (BW) of 5.43 ± 0.43 kg were used in a completely randomized design. There were five pigs per pen, and ten replicate pens per diet. Therefore, a total of 30 pens were used. Pigs were housed in pens with fully slatted plastic floors. Each pen was equipped with a feeder and a nipple drinker, and pigs were allowed ad libitum access to feed and water throughout the experiment. Fecal scores were assessed visually per pen every other day using a score from 1 to 5 (1 = normal feces; 2 = moist feces; 3 = mild diarrhea; 4 = severe diarrhea; and 5 = watery diarrhea) by one single observer. A blood sample was collected from the jugular vein of two pigs per pen (i.e., the gilt and the barrow with a weight closest to the pen) in vacutainers containing EDTA on the day before weaning, and on day 14, day 28, and day 42 post weaning. Plasma samples were analyzed using ELISA kits for concentrations of immunoglobulin G (IgG; Bethyl Laboratories, Inc., Montgomery, TX, USA), interleukin 6 (IL6), and tumor necrosis factor alpha (TNF-α; R&D Systems, Inc., Minneapolis, MN) according to recommendations from the manufacturers. Deproteinated plasma samples were also analyzed for myo-inositol content using a myoinositol assay kit (#K-INOSOL, Megazyme, Bray, County Wicklow, Ireland) according to the manufacturer's instructions.
At the conclusion of the experiment, average daily gain (ADG), average daily feed intake (ADFI), and gain to feed ratio (G:F) were calculated for each phase and for the overall experiment.
Normality of residuals and homogeneity of data were verified using the UNIVARIATE and MIXED procedures (SAS Inst. Inc., Cary, NC, USA) and outliers were identified as values that deviated from the first or third quartiles by more than 3 times the interquartile range using Internally Studentized Residuals (Tukey, 1977). One outlier was detected for IgG on day 0 and removed prior data analysis, but all other data were included in the analysis. All data were analyzed using the PROC MIXED procedure of SAS with the experimental unit being the pen. Treatment means were calculated using the LSMEANS statement in SAS. Statistical significance and tendency were considered at P < 0.05 and 0.05 ≤ P < 0.10, respectively.
Results
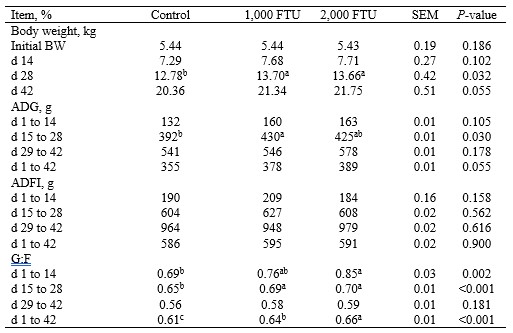
Pigs fed the diet with 1,000 or 2,000 FTU had greater (P < 0.05) BW on day 28 than pigs fed the control diet (Table 1), and these pigs had a tendency for a greater (P < 0.10) final BW on day 42 than pigs fed the diet without phytase. The pigs fed the 1,000 FTU diet had a greater (P < 0.05) ADG in phase 2 than pigs fed the control diet. Likewise, pigs fed diets with 1,000 or 2,000 FTU had a tendency (P < 0.10) for a greater overall ADG than pigs fed the control diets without phytase. Pigs fed the 2,000 FTU diet had greater (P < 0.05) G:F in phase 1 than pigs fed the diet without phytase and pigs fed one of the diets with phytase had greater (P < 0.05) G:F in phase 2 than pigs fed the control diet. Pigs fed the 2,000 FTU diets had greater (P < 0.05) G:F for the overall experiment than pigs fed the other diets, but pigs fed the diets with 1,000 FTU had greater (P < 0.05) G:F than pigs fed diets without phytase. Fecal scores within phases or for the overall experiment were not influenced by the inclusion of phytase in the diets (Table 2).
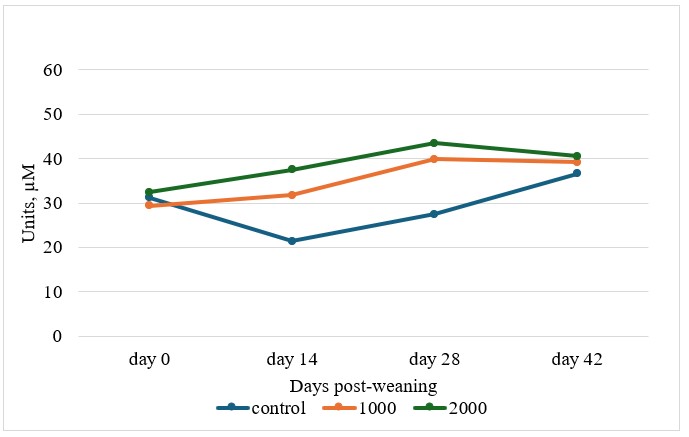
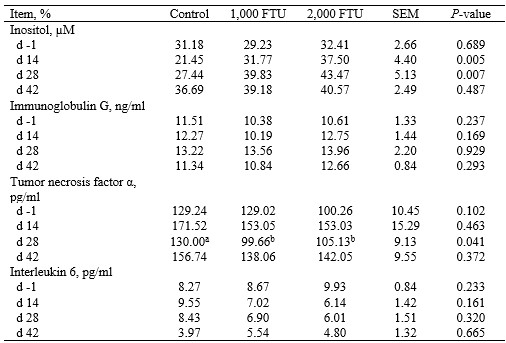
Pigs fed a diet with 1,000 or 2,000 FTU had greater (P < 0.05) plasma inositol concentration on day 14 and on day 28 than pigs fed the control diet (Figure 1; Table 3). Pigs fed a phytase diet also had reduced (P < 0.05) plasma TNF-α compared with pigs fed the control diet. There was no effect of treatment on IgG or IL-6 within phases or during the overall experiment.
Key points:
- Adding at least 1,000 FTU/kg of phytase in diets for weanling pigs helps maintain pre-weaning inositol levels during 6 weeks post-weaning phase.
- Results indicate that maintaining inositol levels post-weaning may improve the G:F ratio of pigs and reduce the concentration of TNF-α in plasma.
Acknowledgement
This work was supported by the United Soybean Board (St. Louis, MO).

Figure 1. Concentration of inositol in plasma of pigs fed diets formulated with 0, 1,000, or 2,000 units of microbial phytase from day 1 to 42 post-weaning.
Table 1. Growth performance of pigs fed experimental diets1,2,3

1Data are least square means of 10 observations per treatment.
2ADFI, average daily feed intake; ADG, average daily gain; BW, body weight; G:F, gain to feed ratio.
3FTU = phytase unit.
Table 2. Fecal scores of pigs fed the experimental diets1,2,3

1Data are least square means of 10 observations per treatment.
2Fecal scores were visually assessed every other day by one independent observer for 28 days. Fecal score: 1, normal feces; 2, moist feces; 3, mild diarrhea; 4, severe diarrhea; and 5, watery diarrhea.
3FTU = phytase unit.
Table 3. Blood characteristics of pigs fed experimental diets1,2

1Data are least square means of 10 observations per treatment.
2FTU = phytase unit.