Apparent ileal digestibility (AID) of amino acids (AA) is affected by dietary AA levels because of different contributions of endogenous AA to the ileal digesta from pigs fed diets with different levels of AA. Because of the influence of dietary protein and AA on calculated values for AID, values for AID obtained in individual feed ingredients are not always additive in mixed diets. Therefore, values for standardized ileal digestibility (SID) of AA, which are corrected for the basal ileal endogenous losses of AA, are used in diet formulations to avoid the influence of endogenous AA on digestibility values, and SID values are, therefore, additive in mixed diets.
When the direct procedure is used to determine AA digestibility, diets containing cereal grains are sometimes formulated to contain AA below the requirement. In contrast, if the SID of oilseed meals or other protein-rich ingredients are determined, concentrations of AA may be at or above the requirement. Because the influence of the basal endogenous losses of AA is eliminated in the calculations of SID values, it is assumed that values for SID are not influenced by dietary concentrations of AA. However, to our knowledge this hypothesis has not been experimentally verified, but it is an important question because it may influence how diets used in digestibility experiments are formulated. Therefore, four experiments were conducted to test the hypothesis that the SID of AA by growing pigs is not influenced by dietary AA levels.
Experimental design
In Exp. 1, thirty cannulated pigs (body weight = 31.4 ± 3.9 kg) were allotted to one of five diets using a randomized complete block design for a total of 6 replicate pigs per diet. Four diets were formulated to contain 5, 13, 22, or 30% crude protein (CP), respectively, by including 10, 30, 50, or 70% soybean meal (SBM) in the diets. An N-free diet was used to determine the basal endogenous losses of AA.
In Exp. 2, twenty-four cannulated pigs (body weight = 22.8 ± 1.7 kg) were allotted to one of six diets using a quadruplicated 6 × 2 incomplete Latin square design with 2 periods for a total of 8 replicate pigs per dietary treatment. Five diets were formulated to contain 7, 14, 20, 27, or 32% CP, respectively, by including 10, 20, 30, 40, or 50% soy protein concentrate (SPC) in the diets. An N-free diet was also used.
In Exp. 3, twelve cannulated pigs (average weight = 39.22 kg; SD = 3.96) were allotted to one of six diets using a replicated 6 × 3 incomplete Latin square design with 3 periods for a total of 6 replicate pigs per dietary treatment. Five diets were formulated to contain 6, 12, 18, 24, and 29% CP, respectively, by including 7, 14, 21, 28, and 35% soy protein isolate (SPI) in the diets. An N-free diet was also used.
In Exp. 4, twenty-four cannulated pigs (average weight = 23.1 ± 2.9 kg) were allotted one of six diets using a quadruplicated 6 × 2 incomplete Latin square design with 2 periods for a total of 8 replicate pigs per dietary treatment. Five diets were formulated to contain 6, 11, 18, 25, and 29% CP, respectively, by including 7, 14, 20, 27, and 34% casein in the diets. An N-free diet was also used.
In Exp. 1 to 4, each experimental period lasted 6 to 7 days. The initial 4 or 5 days of each period were considered an adaptation period. Ileal digesta were collected on day 5 and 6 or on day 6 and 7 for 8 hours using standard procedures. The diets and ileal digesta were analyzed for AA and Cr to calculate the AID of AA in each diet. The AID values were then corrected using the basal endogenous losses of AA to calculate the SID values.
Data were analyzed using the PROC MIXED procedure (SAS Inst. Inc., Cary, NC, USA). The model included diet as a fixed effect. Mean values were calculated using the LSMeans statement, and polynomial contrasts were used to test for linear and quadratic effects of increasing protein feed ingredients on AID and SID of AA. Pig was the experimental unit and an α-value of 0.05 was used to determine statistical significances and results were considered a tendency if 0.05 ≤ P < 0.10.
Results and Discussion
Results from Exp. 1 to 4 indicated that there were quadratic increases (P < 0.05) in the AID of most AA as dietary protein increased (data not shown). This increase in the AID of AA is explained by different proportions of endogenous AA in the ileal digesta when protein level was increasing from low to high.
Results from Exp. 1 where SBM was used as dietary protein indicated that SID of Arg, Ile, Leu, Met, Trp, and Val was not affected by increasing SBM, but the SID of Lys, Phe, and Thr were linearly decreased (P < 0.05) as SBM in the diets increased (Table 1).
Results from Exp. 2 where SPC was used as dietary protein indicated that the SID of Arg, Ile, Leu, Met, Phe, Trp, and Val was not affected, but the SID of His and Lys was quadratically (P < 0.05) decreased and the SID of Thr tended to linearly (P < 0.10) with increased inclusion of SPC in the diets (Table 2).
Results from Exp. 3 where SPI was used as dietary protein indicated that the SID of His, Ile, Leu, Lys, Met, and Trp was not affected by the inclusion of SPI in the diets. However, the SID of Arg and Val was quadratically (P = 0.040) or linearly (P < 0.027) decreased, and the SID of Phe and Thr tended to linearly (P < 0.10) decrease as the inclusion of SPI in the diets increased.
Results from Exp. 4 indicated that the SID of all indispensable AA was not affected by increasing casein in diets.
In the first experiment, we started with SBM, which contains soy-related antinutritional factors including oligosaccharides, fiber, and trypsin inhibitor. Therefore, the effect of oligosaccharides was eliminated in the second experiment by using SPC. The next experiment was conducted with SPI, which did not contain any oligosaccharides and lower levels of trypsin inhibitor. However, the results from the three experiments indicated that the reason the SID of AA changes with increasing soy products is that these feed ingredients contain fibrous components in addition to trypsin inhibitors and unique protein structure that hinders the AA absorption, even though SPI contains very low levels of antinutritional factors. However, when casein was used in diets, the SID of most AA was not influenced by dietary protein, which demonstrated that pigs have capacity to digest or absorb AA even when dietary protein is well above the requirements for pigs.
In conclusion, the SID of most AA by growing pigs is not influenced by dietary CP if there are no antinutritional factors in feed ingredients. Results from the four experiments also indicated that values for the SID of AA in feed ingredients can be determined below, at, or slightly above requirements without impacting results, even though the feed ingredients contain some anti-nutritional factors.
Key points
- Values for the AID of AA are quadratically increased as the inclusion of SBM, SPC, SPI, and casein increased in diets fed to growing pigs.
- The SID of some AA in soy products is reduced if dietary protein is too high, but the SID is not affected by protein levels if casein is used.
- Pigs have capacity to digest or absorb AA even when dietary protein is well above the requirements for pigs.
Table 1. SID of CP and AA in diets containing different inclusion rates of SBM fed to growing pigs1 (Exp. 1)
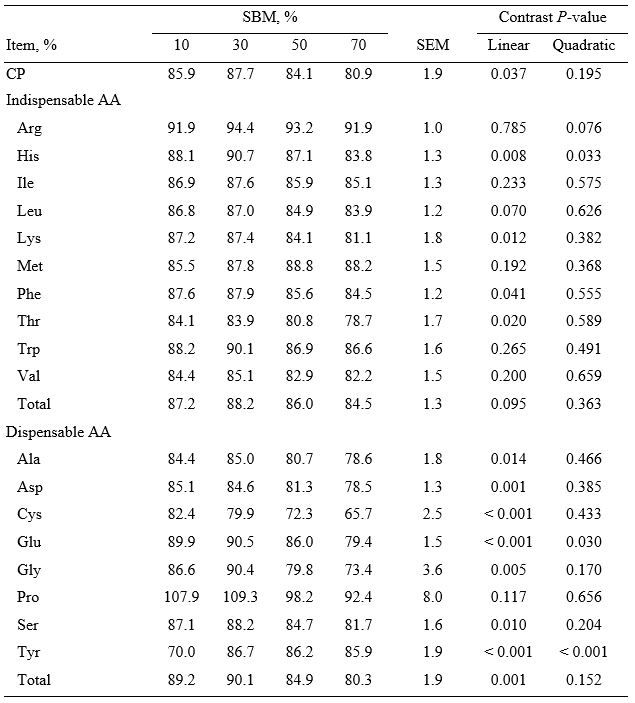
1Each least squares mean for each treatment represents 6 observations, respectively, except for the diet containing 50% SBM (n = 5).
Table 2. SID of CP and AA in diets containing different inclusion rates of SPC fed to growing pigs1 (Exp. 2)
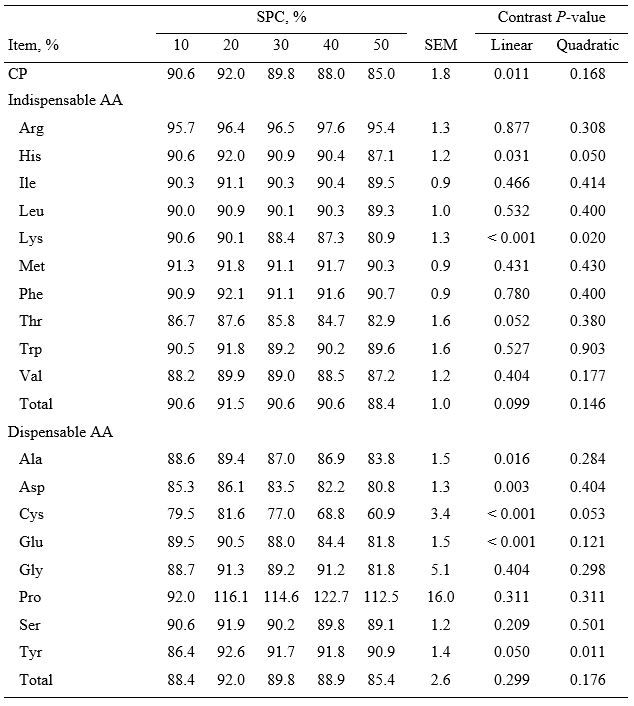
1Each least squares mean for each treatment represents 8 observations, respectively, except for the diet containing 20% SPC (n = 7).
Table 3. SID of CP and AA in diets containing different inclusion rates of SPI fed to growing pigs1 (Exp. 3)
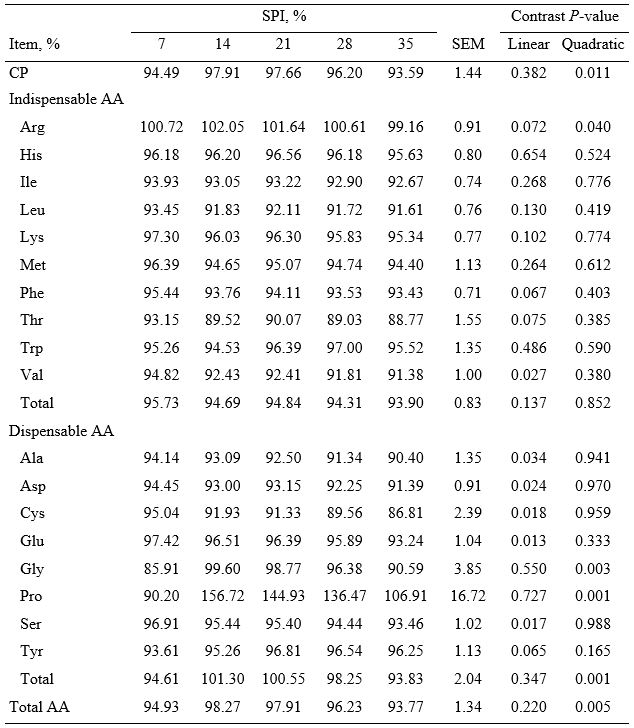
1Each least squares mean represents 6 observations.
Table 4. SID of CP and AA in diets containing different inclusion rates of casein fed to growing pigs1 (Exp. 4)
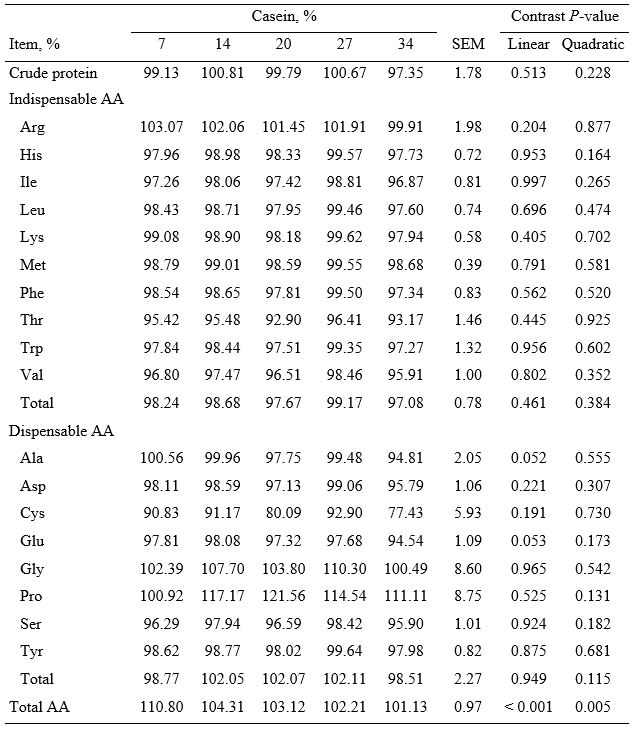
1Each least squares mean represents 7 observations except diets containing 14% casein (n = 8) and 27% casein (n = 6).